Peak Season Hangover: 3 Ecommerce Service Fixes to Do Now

Most e-commerce brands treat returns as a cost centre. A 30% return rate looks like a 30% revenue loss. But the best operators in Europe are turning returns into a profit centre through circular commerce.
Here's how the math works when you process returns right.
The Return Rate Reality
European e-commerce averages 25–30% return rates across all categories. This is structural. It's not a problem. It's the baseline.
- Fashion & Apparel: 35–45%
- Footwear: 30–40%
- Home & Garden: 20–25%
- Electronics: 10–15%
- Books & Media: 5–10%
The bad news: you can't eliminate returns. The good news: 40–60% of returned products are completely sellable. Most brands are wasting this asset.
The Typical Return Path (Broken)
Most brands follow this flow:
- Customer initiates return via website
- Returns carrier picks up and delivers to warehouse
- Warehouse receives return 3–7 days later
- Return sits in warehouse for 2–4 weeks before being assessed
- Rough visual inspection: "looks okay" or "damaged"
- Sellable items go back to inventory, damaged items go to landfill
- Recovery rate: 20–30%
The problem: by the time the return is assessed, 3–4 weeks have passed since the customer returned it. The original order is long forgotten. No feedback loop to product or customer service. No attempt at salvage or refurbishment. Just binary: in or out.
The Circular Commerce Return Path (Working)
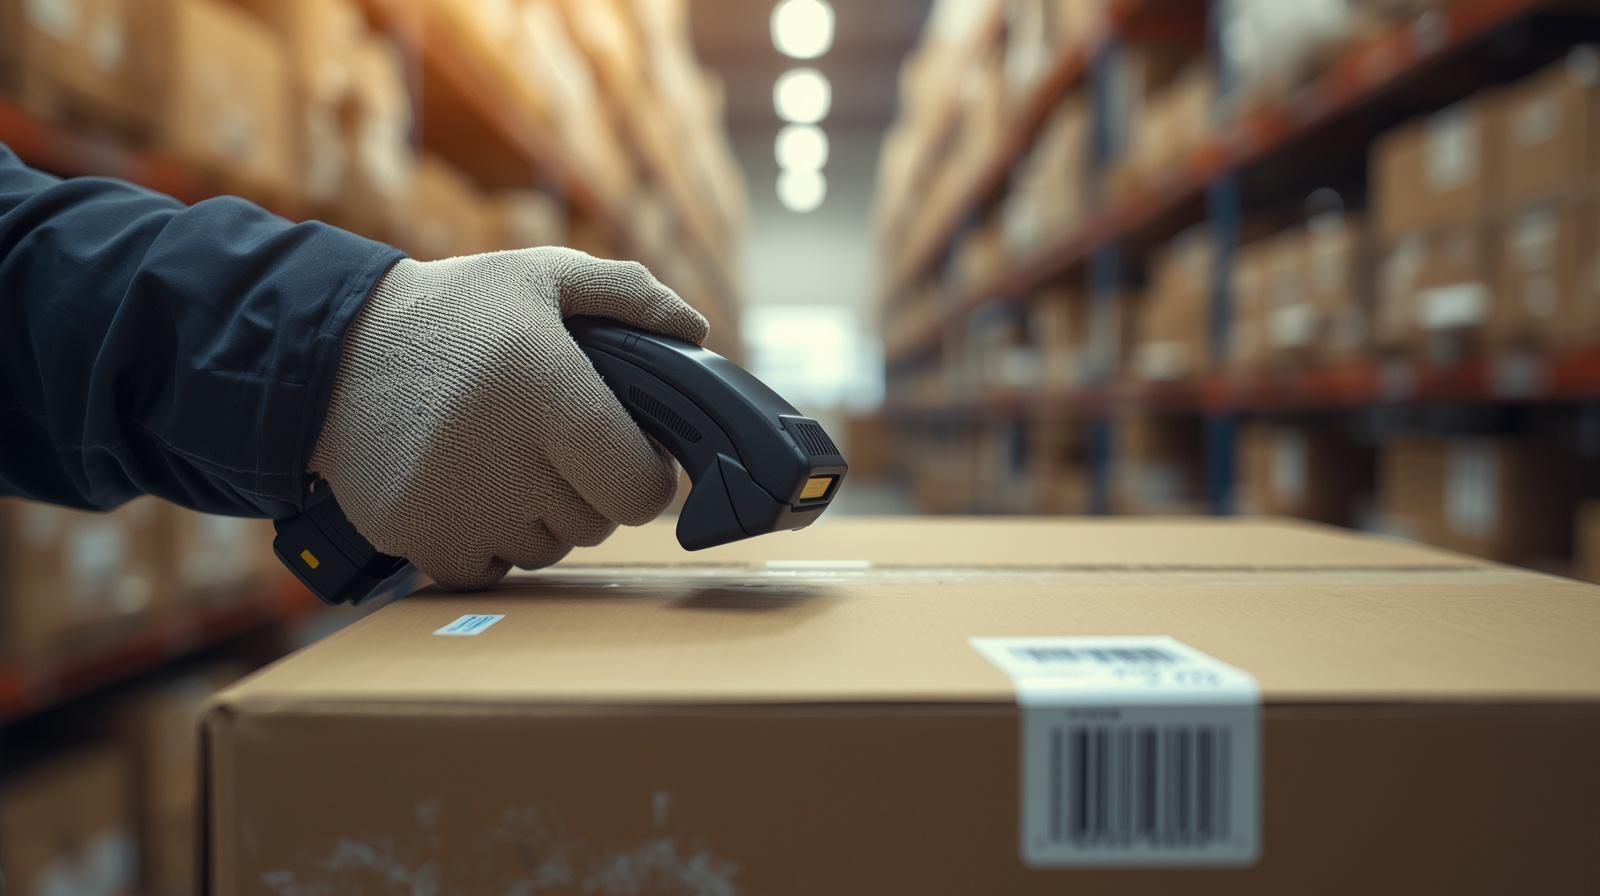
Best-in-class operators follow this:
- Customer initiates return with reason code (size mismatch, color wrong, damaged, quality issue, etc.)
- CS team flags return reason in system — product feedback flows to product and QA teams
- Returns carrier picks up within 24 hours and delivers to nearest local hub (not central warehouse)
- Return assessed within 2–3 days of arrival (not 3 weeks later)
- Professional grading: condition assessment, stain/odour check, defect documentation
- Tier 1 (Like-New, 90%+ recovery): Relisted immediately, shipped locally
- Tier 2 (Good, 70–89% recovery): Minor refurbishment (wash, stain treatment), relisted, shipped locally
- Tier 3 (Fair, 40–69% recovery): Discounted outlet/clearance channel
- Tier 4 (Poor, <40% recovery): Recycling or donation
- Recovery rate: 50–70%
The difference: immediate local processing, professional assessment, and strategic placement. Not binary in/out. A spectrum of value recovery.
The Economics of Refurbishment
Let's calculate the recovery value for a fashion brand with €30 average product cost:
Old Model (Typical):
- Monthly orders: 10,000
- Return rate: 35%
- Returns: 3,500 items
- Sellable after simple assessment: 25% (875 items)
- Recovery value: 875 × €30 = €26,250
- Total return cost (logistics, processing, lost inventory): €12,000
- Net: €14,250/month = €171,000/year
New Model (Circular Commerce):
- Monthly orders: 10,000
- Return rate: 35%
- Returns: 3,500 items
- Professional grading: 55% sellable across tiers
- Tier 1 relisting (30% of returns): 1,050 × €30 × 90% margin = €28,350
- Tier 2 refurbishment (15% of returns): 525 × €30 × 65% margin = €10,260
- Tier 3 outlet (10% of returns): 350 × €30 × 35% margin = €3,675
- Total recovery: €42,285
- Circular commerce operating cost (grading, refurbishment, logistics): €6,000
- Net: €36,285/month = €435,420/year
Uplift: +€264,420 per year on 10,000 orders/month
That's a 2.5x improvement in return value recovery. For a brand at €5M annual revenue, that's 5.3% of revenue recovered instead of lost.
The Operational Reality
Professional return assessment requires trained personnel and infrastructure. It's not a spreadsheet operation. You need:
- Trained graders who understand your product quality standards
- Assessment software to document condition and defects
- Local hubs in key markets (not centralised processing)
- Refurbishment capability (cleaning, repairs, etc.)
- Segregated inventory channels for Tier 2, 3, and outlet products
This is expensive if you try to build it yourself. Most brands can't justify the capex and labour costs. Which is why integrated service providers like Salesupply handle this centrally.
Product Feedback Loop

There's a strategic upside: return reasons create a quality feedback loop. If 15% of returns from a specific product are "seam defect," your product team knows there's a manufacturing issue. If 20% are "size runs small," your product copy needs updating.
This feedback loop improves product quality and reduces future returns. It's a compounding effect: better products → lower return rates → higher margin per order sold.
Sustainability Angle (Real, Not Greenwashing)
Circular commerce isn't just economics — it's environmental imperative. 30% of returned products going to landfill is wasteful. Processing 50%+ back into commerce is circular economy in practice.
European regulations (AGEC in France, VerpackG in Germany, Ecopolicy in UK) are moving toward making brand responsible for end-of-life. Circular commerce isn't a trend — it's eventual regulatory requirement.
Brands that build circular commerce capability now will have a compliance advantage in 2027–2028 when regulations tighten.
The Channel Strategy
Smart operators don't resell everything at full price. They create a strategic channel mix:
- Tier 1 (Like-New): Resell on primary channel at 95% of original price. Customers rarely notice. Margin is intact.
- Tier 2 (Good): Create a "Renewed" or "Refurbished" collection at 75–80% of original price. Markets well. Builds brand trust in quality.
- Tier 3 (Fair): Outlet channel (TK Maxx, Zalando Outlet, your own outlet) at 50–60% of original price. Moves volume.
- Tier 4 (Poor): Donation (get tax deduction) or recycling. Minimal margin but excellent brand goodwill.
The key: every product finds its market. Nothing is wasted. And your margins across the system are higher than typical because you've recovered value across four channels.
Bottom Line
Returns aren't a cost centre. They're a profit centre if you treat them as inventory, not waste. Professional assessment, local processing, and strategic resale across multiple channels transforms returns from a 20–30% margin loss into a 30–50% margin recovery.
For brands serious about profitability and sustainability, circular commerce is non-negotiable. And it's operationally complex enough that most brands need a partner to execute it well.
How much could circular commerce save your business?
Calculate Your Return Recovery Potential →